Tuesday, March 25, 2014

A Family Tree of all Mankind - part 9

Biblical numbers for the Patriarchs.
      Note that "the" Bible gives 2 streams of numerical data: 1.) Age of patriarch when he begets first child. 2.) The length of time thereafter until he dies. The total age of a patriarch is calculated only indirectly by adding the two within our base 10 system, which has some adverse effects on what info we can validly extract from the data. What I mean to say, is that you can't necessarily simply add them and retain full fidelity of the original info. To see that at least something fishy is going on with the numbers, you can crack open even the Bible on your shelf right now and still see lingering syntactical remnants of some kind of previous numerical translation. For example, I'm reading Genesis 5:6 "And Methuselah lived after he begat Lamech seven hundreds and eighty and two years" which is indicative of an additive numerical system, perhaps similar to greek numerals. For example, as recently as the 1860s, we have things like the Gettysburg Address saying, "Four score and seven years ago our fathers brought...etc". Our forefathers used the additive unit of a score which of course is 20 years. Or in the French language today, the number for 90 is still quatre-vingt-dix which translates to four twenties plus a ten. Humans have used all kinds of various additive systems in the even recent past, so we would be foolish to think that whomever originally recorded the numbers in Genesis thousands of years ago understood counting and math the same way we do today. And we'd be equally foolish to assume the various iterations of translations along the way from then until now were all done correctly. More on this later, but for now all I'm saying is lets preserve the two given data streams separately in case some mathematical principal is at work making it invalid to simply add them. Although we'll add them too to see something interesting.
      And here is my attempt at sorting out what all the different versions of the Bible have to say about the numbers given for the patriarchs. (click to enlarge)


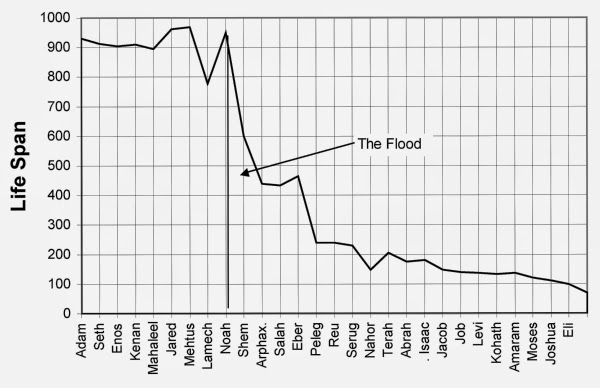
      So taking these numbers all together and scrutinizing them, it seems apparent to me that the Septuagint V. version is much more reasonable than the other data. For your convenience and reference, here's a copy of the Septuagint translated into English. I'm not saying it is "reasonable" per se, I'm just saying that they are the least unreasonable, and most internally consistent. From Adam to Noah they stay pretty constant in the 900s like so: 930, 912, 905, 910, 895, 962, 365, 969, 753, 950, 600 And from Noah to Abraham they go like: 600, 535, 460, 460, 404, 339, 339, 330, 304, 205, 175. Now many people (creationists) have focused on the fact that the postdeluvial numbers follow a pretty smooth exponential-ish decline, and have made the argument that because the decline is so smooth men could not possibly have contrived them, therefore it's divine. But you can forget about that nonsense straightaway. Man is pretty ingenious in ancient times, and understanding the exponential to the extent we do today isn't necessary. But also that is just totally irrelevant - This is not true data. We already established that humans don't live for 900 years. Because Science. These numbers are nominally fallacious.

      For good measure let's consider a lesser known mathematical tool: Benford's Law (aka Newcomb's law). The IRS is using Benford's Law right now to determine statistically if you've been cheating on your taxes. Look it up, and apply it to the first digit of the Patriarchs' data from Noah to Adam.


      It turns out that real measurements taken in the real world have a Benford distribution of the leading digits. This is even true independently of base - whether you're counting in binary or decimal or hexadecimal etc.  Age is not usually the best example for this because to really approach Benford, data should span multiple orders of magnitude, so in this case where we are talking about ages in the ballpark of 1000 years, we should most definitely see a Benford-approximated distribution, but instead we see the exact opposite - about as wrong of a distribution as one could possibly have! You couldn't make it worse if you tried! Purely random numbers should have an even uniform distribution of the leading digits, and real world data has a Benford distribution, which is to say 1 should be the leading digit about 30% of the time. And 9 should occur the least. I won't go into the math details, but the reason this is so, has to do with logarithms needing to be equal, and if you're curious about the subject, I assure you it is very interesting and you can read up about it here or here or here or here or here.
      What does this say about the patriarch ages? Nothing we didn't already know - and that is that they are not literally true, but that's hardly useful. The important question is WHY and HOW is the data wrong?
Benford's law is a seriously powerful tool, and I already mentioned that the IRS uses it to determine fraudulent data. Let me show you what it looks like when people artificially contrive numbers and/or cheat on their taxes:


     Humans are chock-full of all kinds of biases and heuristics that they're not even aware of. One such bias is that we prefer certain numbers to others. Because you and I count and think in base 10, we anthropocentrically prefer 5's and 10's. We tend to round numbers off to these, and our currencies reflect this, and the stock markets tend to get hung up around nice round numbers like 1000 or 15000 and paint psychological formations in the technicals that peak or turn around at these levels, and totally deviate from the fundamentals. So in the modern age, an artificial data set will have a lot of 5's. For the patriarchs' ages we obviously have a preposterous amount of 9's. Here's what the Bible (LXX) is trying to claim the distribution looks like from Adam to Noah:


      Riiight. So the signature is different than what we might expect if the numbers were contrived today, because the original authors didn't count the same way we do. What's up with all the 9's then? Some would say 9 has always typically been a "divine" number for various civilizations across the millenia. It's a sign of respect for your deceased ancestors, or a symbol of the Gods. The Vikings for example revered the number 9 by sacrificing 9 of this and 9 of that to their Gods (and 9 humans), and the infamous 666 is really ultimately the antithesis of 999. Now we're getting into much less-than-scientific territory than I prefer, so I'm going to leave it at that for now, and say, while this is indeed intriguing, this is clearly not the whole correct explanation, but I think it is a part of it. 9 is a special number in the eyes men. If you are curious about the possible historical divine significance of 9 please feel free to investigate further.

      So were the men that wrote the old testament lying to us deliberately in some grand across-the-centuries conspiracy? No, I don't think so. Did God write the Bible or deliberately guide the hand of humans who wrote it, and he made the data that way for whatever incomprehensible reason? No. Did God write the Bible at all? No. Did men who are susceptible to all kinds of human errors and biases write the Bible out of their own human volitions? Yes. Did men live at radically different times throughout history and copy and re-copy and re-re-copy manuscripts written by other men? Yes. Did these re-copyings accrue errors both intentionally and by mistake? Yes. And perhaps the most overlooked, under-rated, and important thing of all that you've probably never really contemplated before reading this article is:

DID THESE MEN ALL USE THE SAME BASE 10 ARABIC-NUMERAL COUNTING SYSTEM THAT WE USE TODAY?
(Hint: No.)

      This is a hugely significant question to realize about the Bible. This is not only important in regards to patriarchs of Genesis, but to all other numerical quantities given by the Bible too (40 day flood eh?). The bible was written a very long time ago, while we and our European ancestors have only used base 10 Arabic Numerals for a mere ~1000 years. Before that, we used Roman numerals. Numerical systems are similar to biological organisms in evolution. They arise with variation, and they survive with selection (and Bibles too!). The best mathematical systems tend to survive, while cumbersome awkward systems like Roman numerals go extinct. You can't even really do calculations in Roman numerals without an abacus - there is a reason Arabic Numerals out-competed them memetically. (We actually have India to thank for the invention of base 10 numerals, but we now call them Arabic Numerals because we were introduced to them by the Arabs during the crusades).

      So let's summarize: The Bible on your shelf is written in base 10 Arabic Numerals. The Mesoritic Texts are written in Roman Numerals. The Septuagint is written in ancient Greek Numerals. Then before that there were the Hebrews. The ancient Babylonians used a kind of blend between base 10 and base 6 called sexagesimal. The Genesis account would have had to pass through the Sumerian civilization as well. Adam and Noah and the patriarchs lived awhile back even before then. And somewhere along the pathway of all that, the concept of zero as a placeholder was invented by different civilizations at different times.
      To really get a grasp and understand how significant this is, we just about need to dig in at least a little ways - I'll at least just scratch the surface of how some of those different systems worked... and I know math isn't everybody's favorite topic.

Arabic Numerals: We're very familiar with these.. This is what we use. Like it or not, you and I right now are viewing the world, not truly objectively, but seeing through a "lens" of base 10 thinking. We're culturally biased, and predisposed to all kinds of other filters too.

Roman Numerals: I'm sure you're probably familiar with these too. Adding sucks, multiplication sucks. You certainly wouldn't want to calculate a cosine on an abacus. Although I will concede that the abacus is a surprisingly ingenious tool, and when I was reading Surely You're Joking Mr. Feynman, I enjoyed his discussion about a man he encountered who learned math on the abacus, and there were certain aspects of mental computation that man could perform easily that Feynman could not. And visa versa. So while I could not claim the abacus is always ubiquitously inferior to modern arithmetic, I think it's self evident that Roman Numerals suck. (but easily translatable, as you should have noticed above that every KJV number is identical to its ancestor in the Mesoretic Texts.)

Greek Numerals: An additive system that uses symbols from the Greek alphabet to also represent numbers in a somewhat similar way to Roman Numerals. One of the problems with classic Greek Numerals is they did not have a zero. Here's a place you can get a feel for them if you want. Arithmetic was hard, multiplication was even worse. I recall reading somewhere also that the numbers aren't all unique - that is to say it's difficult to tell the difference between 34 and 304 and 3400 without context clues. Or something to that effect.

Babylonians: A positional system that used a mixture of base 6 or 60 and base 10. Some relics of their math persist today, like 360 degrees in a circle and 60 seconds in a minute. The Babylonian culture existed right in the heart of the fertile crescent roughly around 1500-2000 BC, so their math is relevant concerning Genesis's pathway from origination to the present day. (Before Babylonia and in the same region, were the Assyrians who used essentially this same math, and invented it.. going back to say 2500 BC)

Sumerians: This empire occurred before the Assyrians, in modern day Iraq. Sumerian math was also a sexagesimal system (base 10 and 6 or 60). It's not the first mathematical system known, but the math of the Sumerians/Babylonians is actually surprisingly superior to that of the later Greeks and Romans! Sumerians were able to divide fractions, multiply into the millions, calculate roots, and raise numbers to several powers. Here and here are some good links about them and their math. It was at the nascent stages of the Sumer civilization when the original Genesis account may have been written.

      So let's grant the supposition that Adam and Noah and the patriarchs existed. But who in their right minds honestly insists you can interpret those numbers sitting there on your shelf literally? Sadly many do. The original data hasn't even the slightest remotest chance of surviving to the present day un-corrupted and true. We know this, and we've known it for a long time. Simply take a look at the different bibles to see the numerical mutations. For the longest time, I used to think the real true data was somehow "encrypted" so to speak, within the numbers we see in the KJV through all the mis-translations (accidental and intentional) throughout the ages of men translating copies of copies. I returned to that same approach on and off over the course of my understanding's evolution, and tried to decrypt the signal out from the noise for this data, and was never really able to solve it to my satisfaction. The noise is just too great, and the signal too small, and I figured no one on Earth knows the complete decryption algorithm, although many have tried.
      There are plenty of theories that are very compelling for explaining certain aspects of the differing data streams of Genesis. There's the missing decimal point theory which recognizes that we've taken for granted the concept of zero as a placeholder. So essentially you divide by 10, and this could be coupled with the interesting observation that the units digit (last digit) of the data is very statistically significantly usually a 0, 2, 5, or 7. This suggests to some that those digits could represent a quarter year, like a season.  Here's a quick histogram of the units digits from Adam to Abraham:


      Personally I no longer believe this is the right explanation, but I used to, and it is indeed one of the better ones out there. There are other similar variants like this where you simply hypothesize that years = months so you just divide by 12. Another good analysis is this one here. I don't think any of these are the right answer either; in fact there is no single process to decrypt the data to arrive at a robust answer.

      Without further ado and beating around the bush, let's just get to the spoiler already. This is how old the patriarchs lived in reality. Take a look at that pdf, and this is the best explanation I know of. So this is perhaps something of a let-down from the approach I articulated earlier about discovering some algorithm to decrypt the data streams to isolate the original signal from the noise, but it's the truth. It now looks as though the original data was never written to be taken literally even in the first place and the numerical data wasn't ever even there at all. It's all noise with no signal.

      No, I'm sure those with the Ken Ham level of pig-headedness will still insist on finding a way to believe the bible literally, most likely with some of their favorite biases like confirmation bias and cognitive dissonance. And all the others. But ultimately it doesn't really matter how old exactly the patriarchs were. Their ages most certainly aren't relevant to determining the age of the Earth the way Bishop James Ussher did in the 1600s. But we do still have their names and their relations to each other. Let me state what I personally believe regarding Adam and Eve: Evolution.

      However. The Fertile Crescent in Mesopotamia was the Cradle of Civilization where the agricultural revolution began at the end of the last Ice Age ~10,000 years ago. It was the birthplace of the wheel and the plow, and all the whole time previously, writing had not yet been invented. Humans communicated to each other via oral spoken language for a long time, and at some point writing was invented. And by mathematical proof and simple logic, there must necessarily be some person who is the first person to be recorded and remembered by written history. I believe Adam is that person. Adam is the first person remembered by written history - it's as simple as that. Suppose we had never heard of Adam or the Bible before, and we had to speculate about what the historical record might tell us from back at our beginnings of written history. The reality we observe is pretty much exactly what we would expect in that case - numbers that don't make a lot of scientific sense, shrouded in ambiguity and uncertainty. Written records of Kings' names are highly likely to precede the written records of their ages, at least insofar as the evolution of that into an over-popularized creation myth goes.
      Another perspective can also be made though that writing and counting originated out of economic necessity, so numbers on clay tablets describing wheat and grain tallies and such should perhaps come along stronger at the beginning than names on king's lists. But a grain inventory isn't going to evolve into a creation myth now is it! Adam and the patriarchs are such a king's list. If they existed at all, they were the kings and rulers of their peoples in the fertile crescent. As anyone who's done deep-genealogy knows: history remembers kings. As a scientist, we know Adam was not the first human being to ever live. He was not divinely created by God, nor was Eve. Eve is much less likely than Adam to have existed, and could just be part of the creation fabrication. If they existed, their names they would've called themselves wouldn't have been Adam and Eve (I've read that Adam means "man" in Hebrew). Obviously they had parents and grandparents, same as every other human that's ever lived. Dur!
      As an agnostic/atheist I've always felt it's so painfully obvious that the Bible isn't to be taken literally, along with astrology or any of that other superstitious nonsense. It truly pains me to explain all this pedantic crap with a straight face, but I know so many people just fail to ever consider these things.
      I want to be clear I do not reject the Bible out of hand entirely. There is a ton of real history to be gleaned from the Old Testament that is more or less correlated with archaeology and anthropology. Like King David and Goliath and Jericho - Those were real historical things (minus any mentions of God of course) that happened. But the dates are a bit off, so we have to calibrate the old testament with archaeology. And we definitely have to keep up our guard of skepticism constantly, because humanity's most precious written record from throughout the ages has been corrupted and influenced by religion. So I will seriously grant that there is a likely chance Adam (and maybe Eve) may have really existed in real history, in some capacity. If so, he was a tribal Chief or King in Mesopotamia, probably close to somewhere about 3100 BC +/- 50 years.

      In my tree now, I've entered a higher-precision speculation that Adam may have been born 3113 BC, right around the end of the Uruk Period. It seems intuitive enough to me he may have been the founding father of that dynasty or regime during the Jemdet Nasr period. As I continue to learn more as time goes on, I've become increasingly convinced that this is right. If so, that would make him our ~200th great grandfather (along with the rest of the whole PCD of say 175th to 225th). Although he is included in my family tree software as 186th great grandfather according to KJV dates, the number of generations is unaffected by the dates, so my number of 186 is plausible. But my tree is somewhat sparsely populated around 2500-2900BC. The reason for 3100 BC is because the great river flood in Mesopotamia is carbon dated to occur around 2900 BC, and since Adam is 10 generations back (or more precisely, 10 back on the kings list), then that is surely more robust than my 186 count. 3100 BC correlates beautifully with the observed average temporal distance of 25 years per generation. It's a much needed calibration for my tree, and if one were to get mathematically motivated, one could take a more exact longevity chart (like I have on page 7) and from it create a more accurate generational period that is a function of time, rather than the constant 25 years. Then integrate it between today and 5100BC. I may do this later. Bottom line is Adam is our ~200th ancestor.

      It's noteworthy indeed that the Jemdet Nasr period began in 3100 BC and ended in 2900 BC, and that the antedeluvial patriarchs list is just perfectly long enough for that period. Archaeologically, the artifacts we're finding there show distinct differences from that which came before. Specifically I think Noah (Ubara-tutu) was the last king of the City of Shuruppak in the land of Caanan (modern day Tell Fara, Iraq) and Adam (Alulim) my have been the first king of the City Eridu in the land of Shulon. And the generations in between correspond to that given by the Sumerian Kings list here.

      So the mystery of Adam and Eve has been solved scientifically. Noah and the flood too (<-- don't skip over this link, it is "the droid you are looking for"). It rained for ~6 days, not 40. Also the Ark was round if it existed. There was indeed a flood that happened locally in Mesopotamia, but in spite of the Epic of Gilgamesh and others, a flood hero and an ark may really still be a myth. The ark may have been a pre-existing barge used for commerce up and down the Euphrates, with some of the local common commercial animals on board. There's no reason to suppose it was one single mono-hull boat, but maybe a conglomeration of lots of boats roped together. Mount Ararat in Turkey is nonsense - that's only been introduced to the story around 1100 AD. The word shadu was the same for both mountain and hill, so it was confused and exaggerated as stories tend to do. There is no chance that any of the Ark survives to the present. Noah's alter has also not survived, but I've heard that the site of the alter may be a real place that's been excavated by archaeologists and is described in chapter 5 of this book which I have not read. Noah may have been also called Ziusudra by some of his descendants which etymologically could be the possible origins of the god Zeus. But that is just a speculation.

But back to what's important, let's not forget that we share common ancestry with all of these too; as well as bananas and lettuce and grasshoppers and bacteria and plants and fungi and dinosaurs... and everything else under the Sun made of DNA:


Checkmate Biblical Literalists.


page 1,2,3,4,5,6,7,8,9 page


A Family Tree of all Mankind - part 8

The Controversy Begins.
      So since math is so much fun, Let me take a sample of some well known ancestors and see how many generations back they are. I'm just going to choose an arbitrary pathway and count only once instead of multiple times (I mean multiple lines of descent). So we won't know where along the Gaussian or PCD the count will put us - most likely near the mean. This is much easier to do if I start counting at the ancestor end, since it was created strictly as an ancestor tree. I can count down from anyone, since they all descend down to me. But it's hard to do in reverse.

Francis I Bryan "Lord Chief Justice of Ireland" aka The Vicar of Hell
d. 02 Feb 1550 15 generations

Edward I "King of England" aka Longshanks
b. 17 Jun 1239 27 generations

William Wallace aka Braveheart
d. 23 Aug 1305 27 generations

William I the Conqueror "King of England"
b. 14 Oct 1024 33 generations

Herod I "King of Judea" during the time of Jesus
d. 11 Apr, 4 BC 74 generations

Constantine I Flavius Valerius "Emperor of Rome"
b. 27 Feb 287 61 generations

King David from the biblical story David and Goliath
d. 946 BC 113 generations

Alfred the Great "King of England"
b. 849 43 generations

Attila the Hun aka "The Scourge of God"
b. 406 D 56 generations

Conn Ceud Ceuthach "110th King of Ireland" aka "Conn of the Hundred Battles"
d. 157 AD 55 generations

Milesius of Gaul "King of Spain and Ireland"
d. 1699 BC 120 generations

Alexander the Great "King of Macedonia"
d. 3 Jul 323 BC 78 generations

Zhou Di Xin (Zi Shou) "Last King of Shang" d. 1134 BC 107 generations

      Doing the math on these (a sort-of-random sample) and seeing how many years between generations, I got very reasonably close to 28.5 years. I so wish my original site hadn't crashed so these links were still good and you could interact and see for yourself. The least I can do right now, because I'm not willing to go rebuild another whole website at the moment, is to link some chapters in pdf, and the motivated reader can investigate as needed to his own satisfaction: Chapter Ancient Ireland, Chapter Egypt Greece Troy and the Bible, Chapter Rome Arabia and Persia, Chapter China.
      Seriously, take a look at those, they're interesting! That's not the whole tree, just some modules and peripheral portions of it that were more manageable. I never was able to succeed in getting the whole thing to pdfs. Chapter Two in the high Middle Ages is by far the most difficult. And it's about twice as big as that now.
      Let's go deeper:

      How many generations to Adam? So there's a million dollar question. Before we open up Pandora's box and dive into this intensely contentious debate, let me just state what my superficial answer is, as observed from my tree: 186 generations. Naturally this comes with a Gaussian distribution, or some other PCD in which Adam would be simultaneously a 150th-great grandfather and also probably a 225th-great grandfather and everywhere in between. Is 186 the mean or median of the PCD? No, 186 is the maximum pathway that I have entered at the moment. What is the minimum? I don't know. What does the shape of the curve look like exactly? I don't know. FTM 2005 can only handle 99 generations at a time... sort of like the Y2K of genealogy software lol. I don't really feel it's worthwhile of my time to start counting various pathways and map out a distribution given by my tree (assuming Adam even existed) because what's given by my tree cannot possibly be real accurate to "truth", whatever that is. Not nominally at least, however I do assert that useful insights can definitely be gleaned. I could start counting: an NP-complete problem perhaps, but... no thanks.

      I have Adam listed as being born in the year 3113 BC. Is that literally true and correct? The answer is no probably not... that's a little over-precise, but I would wager with high confidence he was born 3100 BC +/- 50 years (more on this in part 9). But ask anyone and they'll tell you it was 4004 BC. Where does the ridiculous year 4004 BC come from? Well it comes from bishop James Ussher who lived in the 17th century and used the genealogies of the Bible by interpreting them literally to arrive at that answer. These days, bishop Ussher's numbers are the most common ones recognized, so when I originally made the tree I indulged in the common wisdom (I mean lack of wisdom) and entered the ages of all the patriarchs according to 4004. I've since changed it after learning what archaeology has to say about the matter. But in my Chapter Noah to Adam from 2009, the incorrect dates I used were:


      Let's get right to the point and start offending people outright: Did the biblical patriarchs live for hundreds of years the way the Bible says? The answer is emphatically, a big resounding NO!!! Of course they didn't. How do we know? Because we're not complete morons, that's how. So now that I've ruffled some readers feathers, let me slow way down out of perfunctory, and in the spirit of the no-child-left-behind ideology, lets examine this:

      Reason #1 for why they did not live that long. Because humans don't live that long. In fact humans in the present have a longer life expectancy than they ever did in the past: .


     Reason #2 for why people don't live for hundreds of years. Because. Science.

      This is my webpage so I can say it however I want, right. The Bible isn't meant to be taken literally, and the Earth wasn't created 6000 years ago. If you believe it was, you have my condolences for setting yourself up for well-deserved criticism. Actually I'm just kidding, you don't have my condolences lol. But alright, suppose I try seriously to hold back on the harassment. Whoever you are reading this - you believe whatever you believe, and whatever I say isn't likely to change that. So let's remain calm and examine on, as objectively and reasonably as we can. The question remains: How old did the patriarchs live? Well there's no shortage of charts out there on the internet. Here are a couple: (click to enlarge)


      Where does the data come from that make these charts? Anyone can tell you, "Dur, The Bible tells me so." And thus, we run into our first problem: "THE" Bible tells us so? The keyword here is "the". Which bible is that? The King James Version sitting on your shelf? Is that the best source for this information? No. For one thing, we need to divide up "the Bible" into smaller modules for clarification. Forget about the new testament entirely. Let's also for now forget about all other books of the old testament except Genesis. So only considering Genesis: What about the Masoretic Texts? What about the Dead Sea Scrolls? What about the Septuagint? The Samaritan Pentateuch? The Torah? The Vulgate? Wouldn't it be a miracle if all these different versions of the Genesis account gave the same numbers? Well I don't believe in miracles and this is no exception. All these bibles tell the same story but with different numerical mutational differences! Mutational differences? that sounds strangely reminiscent of evolution. So enter a good dose of irony - the fact that the Bibles themselves exhibit a case of evolution, which is exactly what one would expect to see anyway, had one ever given it some thought.

      So long story short, I have come to believe that the Septuagint (LXX) is the best version of "the" bible to use. This is a whole other story in itself that I may eventually get around to writing about why this is so. For now, you'll just have to take my word for it (or investigate it yourself!), and thankfully we're fortunate to live in the modern era where we have the benefit of having discovered the Dead Sea Scrolls to help us confirm that the Septuagint is indeed more accurate than the Mesoritic Texts. Although we should already immediately know that the KJV sucks the most, simply because it was written the most recently. I think everyone can agree that an original is always better than a copy. And we know that a copy of a copy of a copy of a copy tends to have less fidelity than the original. The Septuagint was written several centuries before Christ, and the Septuagint is actually the bible that Jesus and his disciples used themselves. But then along came our mutual ancestor, 60th- Great-Grandfather Constantine I - Emperor of Rome, who converted Rome to Christianity for political reasons, and I'm sure you've heard about the Council of Nicea in 325 AD, and there was a culling of various apocryphal texts. And to make a very long story short, people today have come to thump unjustifiably hard on the King James Version (KJV) sitting on their shelves, which is a direct descendant of the Mesoritic Tests, which is something like a nephew or a great-nephew to the Septuagint. So we need to realize that the book actually sitting on your shelf, written in English, quantified with base10 Arabic Numerals is not the preferred source of information to call gospel.
Please repeat after me:


      Aren't I aweful lol. Now I'm just being belligerent again. Here's a rough family tree of how the different versions of the Bible relate to each other:
<insert Bible's evolutionary tree here later>
(This is more non-trivial than I thought since certain books of the bible, and groups of books, and apocryphal texts etc. aren't necessarily unique indivisible modules that descended orderly in a family tree pattern? I'll try to work on this later.)

      Please do your own research on most of this stuff if you are curious about it. I'm basically diving into the biggest controversy man has ever concerned himself about in all of history here, and it's beyond the scope of this website to talk about all the things that need to be discussed. The main point I am trying to make right now is to claim that the Septuagint's numbers are the most superior numbers to use that I know of. As it turns out, many people disagree - Imagine that. (Bonus question: Notice a correlation between those who disagree and those who have some sort of hegemony with a basis deriving from the Mesoretic texts? ie Rome, or Israeli Gov't)


Continued on page 9.
page 1,2,3,4,5,6,7,8,9 page

A Family Tree of all mankind - part 7

Gaussian Distribution.
      Let us return to the question: "How many generations of descent are there between myself and Charlemagne, born in 741 AD? Well I jump into the tree and start counting, picking some arbitrary line of descent and I count 40. But if I do it again taking a different path, I just counted 46. I am able to determine that the maximum number of generations out of all the lines entered into my tree between Charlemagne and myself is 49. I am unable to determine the minimum with certainty, but after a good investigation I've counted a 36, but I'm going to make 35 the minimum. MOST counts come up about 42, with few coming up at either extreme. This is a Gaussian distribution! It may be skewed one way or the other, but it's too hard for me to investigate this formally. Let us hypothesize that it's symmetrical around the mean, and we can now answer the original question in a definite way. How many generations back to Charlemagne? The answer is:


      He is ALL of the above, all at the same time. He is our 33rd Great Grandfather, and he is also our 47th Great Grandfather, and everywhere in between. We should say he is our 40th Great Grandfather (42-2), since that's where he occurs the most in the pedigree. But to be completely correct and mathematically rigorous, his ancestral distance from us is a Gaussian with some mu (mean) and sigma (standard deviation). If you are not familiar with the normal distribution you should read up on it because it's extremely common everywhere.


      What about your immediate grandparents - how far are they away from you? 2 generations of course. But even that comes with a Gaussian distribution; it's just that the standard deviation of such a near ancestor is zero, because all 4 data points lie on the mean! To generalize, all ancestors, even as near as your parents, can be described as being a Gaussian distribution away from you, characterized by the 2 parameters mu and sigma. The further you go back, the greater mu and sigma both become, and the more closely the curve approximates the normal. The nearer in time an ancestor is to you, the more "lumpy" the curve will look, as it can't look very normal yet with poor resolution. I'm going to call this phenomenon in genealogy Pedigree Collapse Distribution (PCD), although I haven't ever seen that term before. Note: The true distribution is not likely to be a true gaussian, but I think that's the best way to imagine it.
      I'm not sure how the aristocracy bias inherent in my tree effects the PCD shape, but I would think it has the effect of skew. We know there is a demographic difference between the rich and the poor, and we also know the average longevity of humans (aka life expectancy) has been increasing with time. The following chart I have found online:


      So I make the assumption that the rich had a longer average life expectancy than the poor, which I think is very reasonable. I maintain that my postulated "average age between generations" of 28.5 years in my tree may still be plausible in spite of the fact that the above chart line shows the average age of everybody is less. Without the aristocracy bias, clearly it would not be possible for the average span between generations to be 28.5, when the average life expectancy of the population is 25.

      One more thing about Pedigree Collapse. There was a famous legendary debate in 1860 between Samuel Wilberforce, bishop of Oxford and T. H. Huxley who championed Darwin's evolution.
      "...the Bishop rose, and in a light scoffing tone assured us there was nothing in the idea of evolution. Then, turning to his antagonist (Huxley) with a smiling insolence, he begged to know, was it through his grandfather or his grandmother that he claimed his descent from a monkey?..."
Sounds like the bishop thought he was quite clever. Hopefully the answer is apparent enough - both.


Continued on page 8.
page 1,2,3,4,5,6,7,8,9 page

A Family Tree of all Mankind - part 6

Charts and Graphs.
      So back to my project. What the heck does the family tree for all of humanity even look like? We can answer this taking it in small pieces. Let's start with a chart of human population over time:


      Human population is trying to grow exponentially while also being constrained by a ceiling of finite resources. Let's flip that on it's side by rotating clockwise to imagine what a descending tree from a single ancestor (like Adam) looks like:

      But my ascending tree is building up in the other direction starting from my trunk in the present. My ascending tree resides within the larger descending boundary of world population. They are both growing exponentially in opposite directions toward each other, until they meet:


      And you get something like a diamond shape on the inside. That's what my ancestor tree should look like in theory. It expands outward until it hits the limits of world population at which point it can't grow anymore because that's impossible! This is all dramatically over-simplified of course because the whole world isn't one giant pool of population. There were geographically isolated groups of people whose separate gene pools were like different little petri dishes all cultivating their own stuff, with little bits occasionally being transferred across and between like strands. Occasionally we had major migrations and invasions, and mainly royal families intermarrying across larger geographic distances. Globally, we had major petri dishes like the Americas, Indonesia, China, and Africa etc. Then within those we had smaller, more locally integrated petri dishes like France, Spain, Britain, Germany, and Scandinavia etc. So I envision my local ancestor tree within the global descendant tree as this sort of football-shaped overlapping lattice structure that I'm going to try to draw in paint, but it really doesn't do the image in my mind much justice:


      Lol. Do I get an A for effort for this masterpiece of art? C+ maybe? Most other articles I've read refer to this phenomenon as a "diamond" shape, or a 4-pointed-star rather than a football I think. And they may have a point (ha ha pun), but I do prefer to think of it as a football because a football is more 3D. This is only a very rough 2D depiction of a higher dimensional landscape of our ancestors. I think it would be very excellent if someone created an interactive 3D model or space to display the whole world's family tree (ascending and descending both) in which time is along the z axis and geographical location is along the x and y. So imagine that you had a Cartesian map of the Earth on the floor making up the x and y dimensions. The present day (time = z = 0) is the floor level, and going up in the +z direction goes back in time. Within a computer model, such a simulation could handle all ancestors and cousins as points that could be connected by lines of relationship. Following the lines, either up or down, one would see the tree branching out, and fusing back together. This would be really cool to zoom in and out of, and click on individuals to bring up info, and trace certain pathways, and get a more visual understanding of what deeper trees really look like instead of just many separate slices of it, 2D at a time. I don't have the time or ability to create this, but if someone else reading this does have the programming skills, I think would be really educational and insightful to build a platform for this network. It would be an interesting alternative to the way genealogy is being displayed now on the internet with hyperlinked webpages for the nodes. These provide an "inside-view" of the footballs but never the whole bigger-picture at any given time.
      Everyone now living or who has ever lived and is known could conceivably be plotted/imported in, as well as primates, mammals, dinosaurs and the whole gamut of the rest of life's evolution too. And I'm certain that by getting a better visualization of certain aspects of a network of individuals in a population like this, some insights can be gleaned that are applicable to understanding the relationships and interfaces between different species, in particular - primates.
      For example, we know that during evolution mutations occur, and some of those are favorable and eventually come to dominate in the population, while the competing traits/genes that were inferior go extinct. It's tempting to simply understand this by imagining all the later population being descended from the one individual who made the original mutation, but not descended from the rest of the population that didn't mutate. But this is not correct. Remember I showed on an earlier page how everyone is descended from ~80% of a whole population, and no one is descended from the remaining ~20% whose progeny went extinct. (80 and 20 are just variables of course, that would differ between species and situations) The evolution of the genes in the pool is separate and subtly different from the evolution of the individuals, which are massive conglomerations of the genes. The interface between different species are therefore not singular "points" of connection (or a single pair of 1 male + 1 female), but are regions of width and length in the xy plane of my imagined model. Like when humans passed through the Toba Catastrophe genetic bottleneck 70k years ago, this is what that would look like:


      You could imagine tracing only your mother's mother's mother's line etc... until you can get no further. Then you could extend that by what you know about your mitochondrial DNA, which only females pass on. I read a wonderful book by Bryan Sykes called The Seven Daughers of Eve that lays out a depiction of what genetic analysis has to say about humanity's matrilinear ancestries. A case is made that depending on which humans on Earth you sample, there are seven major genetic Eves from which humans might descend. Those 7 Eves lived at very different times and places, and are themselves further descended from all humanity's singular most-recent Mitochondrial-Eve (M-Eve's mother would also be an M-Eve, but at some point there must be a most recent one). On the other hand you can trace your father's father's father's line etc... and extrapolate that together with your Y-Chromosomal DNA to do the same thing patrilinially to your Y-chromosomal Adam. These 2 extremes within your tree form a special boundary or outline of what your personal ancestor tree looks like, but there is also everywhere else in-between the outlines. If you go up one generation (to your parents) and do the same for them, and plot out their matrilineal and patrilineal lines, they will follow different pathways back through the intermediate Adams/Eves on their way back to the first universal ones. This hypothetical ancestor is called LUCA for Last Universal Common Ancestor. It's important but subtle to also understand that the LUCA-Adam did not necessarily need to live contemporaneously with the LUCA-Eve.
      I've read that scientists now believe Neanderthals and our Cro-Magnon ancestors that displaced them did interbreed to an extent, and some small percentage of our DNA today comes from them. I also recall reading somewhere the hypothesis that they couldn't interbreed because of different chromosome numbers, which would cause their offspring to be sterile (like how the Mule is a cross between horse and donkey), but I suppose that hypothesis was falsified. Anyway, the point is that if this is true we are all descended from the whole population of Neanderthals (or ~80% thereof), not just a few specific ones. And if it was possible for other species of the ancient primates to interbreed, then scientists' quest to find the missing link of our human evolutionary pathway through the primates may not be asking the exact right question. There may in fact be multiple correct pathways.

      Back to my tree project - the next chart shows a sideways view of the football structure from my above artistic-masterpiece. I'm able to take some actual data from my tree and show how it compares to the "diamond point" or star or football theory. This next chart shows the "width" of my tree project's data. Keep in mind, in practice the width is determined by how many ancestors at a given generational slice are known and therefore entered into the software, and in theory the width would be much greater if we had complete information. But we'll take what we can get, and hope that in practice and in theory correlate to some degree. Which I think they do.


      On the X axis is the number of generations going back from the present time. On the Y axis I have number of people (For example, if you went back 3 generations your width at that point would be 8 people, assuming no pedigree collapse.) This chart is at its widest 28 generations ago. Using 28.5 years per generation, that is 800 years ago at around 1200 AD. What's significant about this chart are the two curves 1.) along the uphill slope on the left, and 2.) along the downhill slope on the right. The curve on the left is an exponential - It's growing at a rate of 2^n, or at least it would be if all the ancestor slots were filled in. But of course they aren't, as I explained earlier, so the growth is slower than 2^n. The downhill curve on the right shows exactly what you would expect to see in a deep-time family tree, and that is the pedigree collapse, which again, is where the same sets of ancestors start appearing in multiple places in the pedigree. In my tree at around 800 years ago, the rate of pedigree collapse starts to overtake the rate of exponentiation to new unique ancestors.

      Let's examine the timing of the peak at 800 years ago. Imagine that inbreeding doesn't happen, and that all our ancestors were unique. That comes out to 2^28 = 268 million people. What was the population of the World at that time? Well it was something like 350 million. But let's forget about the world as a whole and let's just talk about Europe, because 99% of all the people listed in my tree from 1200 are in Europe. Actually my tree at this point probably gives a pretty fair representation across Europe as a whole, including France, Spain, Germany, Britain etc. The population of Europe in 1200 AD was close to 100 million. Clearly 268 million unique ancestors at this time is impossible, not to mention that my listed names are mainly the rich and aristocratic who made up only a minority of the actual population. Objectively, most of our ancestors were the peasants and the poor. So clearly, pedigree collapse has been happening to a great extent well BEFORE the peak at 28 generations, but to repeat what I said earlier, it is the RATE of pedigree collapse that overtakes the RATE of exponentiation that this peak at 800 years ago represents. Another interesting observation: There is an unusual, significant spike right before the main spike that occurs at about 26 generations back. It seems to me that the obvious explanation for this anomaly is the bubonic plague. After all, it is occurring at just the right time when the plague decimated Europe. (The word decimated actually doesn't do the plague justice, since the etymology of that word comes from when the Roman legions' commanders would kill 1 out of every 10 soldiers - hence the prefix "deci". So if decimation kills only 1 in 10, it doesn't quite do the plague justice. But I digress.) I suppose the plague killed off the wealthy less-so than the poor, but regardless of the actual casualty rates between the rich and poor, and given our chart's bias toward the rich, the concern people had with record keeping would have also probably declined at this time. Who is going to concern themselves about genealogy and record keeping when everyone's dying? When 30% to as high as 70% of a population gets wiped out, you might expect genealogical data we have 700 years later to be attenuated, and that does seem to be the case.

      Another observation: The chart also shows a local peak at around generation 15. Let's do the math (15 * 28.5 = 430) which puts us back at 1575 AD. The immigration of people to the Americas is a notoriously difficult bridge for genealogists to gap. Most family lines dead end without a trace around this time, so we are not surprised to see this peak here either, being immediately followed by an attenuation in the chart. It's pretty common to be able to trace back a few generations from the individuals that actually did the immigration, but still 1575 AD seems a little on the early side to be seeing a peak for the American immigration. It turns out, the small peak at generation 15 comes mostly from the French Canadians which seem to have keep excellent family tree records back until about 1600 AD. What about that small but discernible bulge of expansion out at 70 generations ago? That is the Roman empire. 70 generations would put us right back at around the year 0. As before, that bulge is indeed correlated to increased record keeping, and availability of genealogical data. The Roman Empire has been described as a beacon of light in the otherwise barbaric past, and so it's no coincidence that the bulge occurs right where you might expect to see more data and person entries in the tree.

      I said earlier that my Family Tree Maker 2005 software only allows me to handle a maximum 99 generations at a time, so that's why the chart ends at 99. Because of the nature of how I produced this chart using FTM 2005, and because the way it handles duplicate ancestors (pedigree collapse), this chart is only a good approximation to the way things actually occur in the tree. And of course my family tree itself is only an approximation to the way our ancestors actually were in reality. So I'm just pointing out that this approximation of an approximation to reality is less than perfect, and there's an inherent margin of error. Furthermore the software wasn't at all designed for this level of insanity. It's more of a consumer product for retirees that want to upload photos and produce pretty charts within say the last 200 years.

For good measure, here's the same chart as above but shown cumulatively:


      Note that this chart approaches the number 24,523 asymptotically because that's the total number of ancestors in the tree. If I could plot the x axis all the way out to the end, the last data point would occur at (186,Y-2):

The fabled Adam and Eve.

Continued on page 7.
page 1,2,3,4,5,6,7,8,9 page

A Family Tree of all Mankind - part 5

Everyone is related.
      Ok so this is all mind blowing and hard to swallow right? Descent from Adam and Eve psshht ya right! Well I should talk about how I even made this tree in the first place and where did the data come from? The answer of course is the internet. All my data ultimately came from other people who uploaded the info onto the internet. Except the more recent data closer to the trunk of my personal tree that is relevant to myself. Believe it or not, it's actually easier to find genealogical data the further you go back, because the further back an ancestor lived, the more descendants he has now living. It is said that there is a genealogist in every family, so the more genealogists there are researching an ancestor, the more is known about that ancestor. This only applies back to about 500 years ago or so, and after that you just take whatever you can get - whatever history remembers. And the question must be asked: "How true and valid is this tree as a whole, in its entirety?" Can we really swallow the hypothesis that Adam and Eve were our 186th great grandparents and every discrete step along the whole line of descent could actually be valid and continuous? Answer: The tree is only as true or valid as the sources that provided the info. In recent times those sources could be birth records, death records, wills or probate records. Further back, say 300 years ago you might get letters of correspondence or ships' logs of passengers or legal records of land holdings. Further back, say 500 years ago in England you might have only scant Church parish records - the lucky ones to not have been consumed by fire yet. Beyond that in the middle ages, there is surprisingly a lot of information for the genealogies of land owners. For within the houses of the barons and aristocracy, there could be many diverse sources of info that correspond like puzzle pieces coming together to recreate the family tree picture. As you continue to go back further, the validity and fidelity of the information decreases sharply as you deviate from royalty. Once you get back to around the Norman invasion of England and the Battle of Hastings in 1066 AD, information drops off very sharply for everyone. It's similar to the way family trees tend to vanish as you try to cross the barrier of the American immigration. The Normans who were ultimately of Viking ancestry invaded and displaced the Saxon royal houses, and in Saxon England before William the Conqueror, people didn't have last names. Last names emerged after this time by law and decree for the purposes of tax collection. So for pre-1000 AD in England and Europe ancestry is constrained mainly to the extreme upper levels of the elite. At this point, pretty much any document of written history is fair game. The Bible gives all kinds of genealogies from Adam to David to Jesus and everywhere in between, so I used that data. Archaeology and the hieroglyphs of ancient Egypt give us bits and fragments of dynasties and royal lines. The Annals of Ireland give genealogies. Clay tablets, or old manuscripts or papyrus scrolls salvaged from the Great Library of Alexandria were used. Essentially anywhere and everywhere that family lines and relationships can be found is all fair game. And it's certainly the case that many contradictions, inconsistencies and impossibilities come to bear. There has always been plenty of incentive for people to engineer and contrive pedigrees of descent from royalty where objectively there was none. But what I have done personally is just to accrue and compile as much as I can from home on the internet - trying to assemble it all into a coherent, self-consistent ancestor tree as much as possible. So there certainly are many deviations from reality. Certainly it is not all objectively true. The tree as a whole is only as accurate as the fidelity of the original sources. So I hereby give you the following disclaimer, which also appears on every page of the books I've printed out:

"The relations herein shown are only displayed with as much accuracy as possible. The author feels this family tree to be about 95% correct in its entirety, but should be viewed as more of a guideline for future research than as 100% literal truth." (Note: most of the tree occurs within the last 1000 years of present, so on the average perhaps 95% is plausible? Obviously as you go back further, a claim of 95% accuracy is flat-out ridiculous when you're in territory of myth and legend.

      That said, this family tree is clearly a lot more than my own personal family tree - it is all of humanity's. Is it any reason to get a big head because I can claim I am directly descended from King Edward I "the Longshanks" of England, and William Wallace, and Robert de Brus and the whole host of other characters from Braveheart? No. Everyone is descended from all these same royal families and dynasties. It's long been known in the genealogical community that if you have any European ancestry at all, it is mathematically certain you are a direct descendant of Charlemagne. Or to phrase it more correctly, the probability that you are NOT a direct descendant is so close to zero that within some confidence interval, we can be 99.99% confident that statistically yada yada blah blah etc etc.. <insert statistical analysis here>. I recall reading from several sources that,

"...If one goes back far enough in time, approximately 80% of the individuals are ancestors of everyone in the current generation, with the remaining 20% having no descendants in the current generation...(Chang 1999)"

      Which is to say that while you are descended from Charlemagne and royalty, you are also descended from ~80% of the entire population from across that slice of time, while all descendants from the other ~20% have gone extinct. Note that this statistic comes with the condition that progeny is modeled as a Poisson distribution. So it's nothing special that we're descended from royalty - you are, I am, and so is everyone else. The only question is are you dedicated enough to trace it? Now that the genealogical community has had the benefit of the internet for several decades, some really interesting phenomena are beginning to emerge. My tree back in 2009 might possibly have been the world's largest coherent unified ancestor tree in existence. Or maybe not, but even if it was or is, it won't be for long. Someone can simply take it and add a few more ancestors, and poof, now theirs is the biggest. I haven't really kept up with genealogy since 2009, but it appears to me there are some mega-gigantic world family tree projects being assembled and compiled democratically from many remote participants and contributors. In an emergent, bottom-up, open-source kind of way, these things are being built up in the online community, and soon enough my huge tree that took me literally thousands of hours to construct will be obsolete. So for whatever it's worth, that's why I'm trying to publishing it now instead of sitting all alone on a hard drive.

Continued on page 6.
page 1,2,3,4,5,6,7,8,9 page

A Family Tree of all Mankind - part 4

Inbreeding.
      Let's pick an extreme case of royalty inbreeding. If Anna Gevedon's tree made you cringe, observe the pedigree of King Charles II of Spain, last of the Habsburg dynasty:

 
      This amount of inbreeding was pretty incredible. The effects were so bad that Charles II was handicapped from genetic mutations. It's no coincidence he was the LAST of the Habsburg dynasty to rule. It just doesn't get any worse than this. Or does it? Turns out it does. Here is a pedigree of an ancient Egyptian royal line that I have picked out of the tree. It begins with 155th great-grandfather Unas (Oenas), Pharaoh of Egypt in 2375 BC and shows the next 20 descending generations within the central ruling family, ending with Senebtisi Queen of Egypt in about 1800 BC who was our 135th great grandmother. (Quick math check for plausibility: 3800 years / 137 = 27.7 years per generation). Remember I said the average was 28.5. This was about 4000 years ago and as King of Egypt, you were a God literally. It was traditional to marry your half-sister to keep your divinity in the family, and this happened for many generations.

 
      There are also many biblical examples of incestuous relationships - in particular, the well known story of Lot (tree link) in Chapter Genesis of the tree. But compared to what we've just seen within the royal dynasties of ancient Egypt, none of that really has much shock value in comparison.

Continued on page 5.
page 1,2,3,4,5,6,7,8,9 page

A Family Tree of all Mankind - part 3

Pedigree Collapse.

      So follow along with me in this thought experiment: Consider yourself as the trunk of your personal ancestor tree that gets bigger as time goes back and you have 2 parents, and 4 grandparents etc, and if you go back n generations, then there are 2^n ancestors. Not all of those ancestors are known to you, but nevertheless you DID HAVE an ancestor in every slot of your pedigree. If one were to go back enough generations(n) to where the amount of ancestors(2^n) at the time was larger than the total number of people even living in the appropriate cultural location of the world at the time, clearly this basic exponential model breaks down. It's a good enough approximation for most small family trees, but insufficient for large ones. That's where pedigree collapse comes in. Pedigree collapse is essentially a nice term and synonym for inbreeding. Pedigree collapse happens in everyone's family tree, and it's a mathematical fact and a certainty that we are all inbred. So get over it. It is a fact that every human being on Earth is a cousin to every other human being on Earth. Your parents were cousins before they were married. My parents are cousins. Everyone's parents are cousins. My wife and I are cousins. YOU are MY cousin, and I can say that with 100% certainty without even knowing who you (the reader) are. Pedigree collapse occurs at every union of man and woman, so the inbreeding issue is not whether we are related, but only how closely are we related. For kicks, here's an article I saw that explains how we're all much more closely related than most realize. So mathematically we understand why pedigree collapse must happen, but what does that actually look like in a family tree? Let's consider the pedigree of one Anna Gevedon - a 4th great-grandmother born in 1822. Her parents were first cousins. And each of her parents' parents were also cousins with each other. And as you go back further, I have trouble even describing it. It's easier just to see with a chart:


      Now that's a pretty close family. This is back in Kentucky/Virgina by the way. So how many Ancestors does Anna Gevedon have? Well she has 2 parents and 4 grandparents - so far so good. But she has only 6 g-grandparents instead of the usual 8. She actually has nine g-g-grandparents instead of the usual 16 (Try to count them). And 5 generations back she has 16 ancestors instead of the usual 32! This is what pedigree collapse looks like. Anna Gevedon could have had 32 different unique ancestors 5 generations back, but she doesn't - she has 16. Of course she has 32 slots to be filled in on her pedigree chart, it's just that multiple spaces are filled by the same individuals. In the case of Anna Gevedon's ancestors, I think we can agree inbreeding was a little excessive. But how much is excessive? What does that even mean, and compared to what? To assert that inbreeding is "excessive" is just an opinion coming from the values we've had given to us from the society we are presently in.. and also the marriage laws of whatever State you're from. But society hasn't always been the same way it is now. Consider people that lived 500 years ago or more. People traveled much less back then, and many people actually lived out their entire lives within a few miles of where they were born. Not to mention there were less people in total. Furthermore, literacy and record keeping weren't good, so people may not have even known they were marrying a relative. So for a multitude of reasons, it is certain that inbreeding was much more common in the past than it is today. For the aristocracy too; they especially had the incentives to marry other aristocrats and keep wealth in the family. In a society where everyone was looking to marry "up" in social status, the result can be seen in the genealogies. Within a family tree, inbreeding manifests itself as massive pedigree collapse during the time of aristocratic rule in Europe, and then even more so further back in feudalism where land holdings were tied directly to politics. Remember people didn't marry for love, but Kings married off their daughters to other Kings for the purposes of political alliance. This brings up an important detail about my family tree project. Who does history remember well from 1000 years ago? Aristocrats. Who does history NOT remember so well from 1000 years ago? Everyone else - the peasants and regular folk whom made up the majority of the population. Any further back than a few centuries ago, and my tree is populated almost exclusively by the rich and the affluent. Deep-time family trees like this have what I call Aristocracy Bias or Royalty Bias. The data available to genealogists and historians is heavily biased in favor of kings, queens, lords, dukes, earls, barons etc. That does not mean that we aren't descended from the whole lot of peasants and everyone else across a population. Of course we are. We just have little hope of tracing down their names or relationships because that information is forever lost to the depths of history. So the poor were marrying amongst themselves and having children in small local communities, not travelling very far, while the aristocrats and royalty were marrying amongst themselves separately from the poor, and travelling much further on average. As royalty from different regions all strove to interbreed with each other, they also had more surviving children than did the poor, but only a portion of those children born to wealthy parents remained in the wealthy gene pool. Typically the eldest male child inherited estate, while the other siblings had to make their own way in life, and their descendants tended to trickle down into the ranks of the poor. Seen from the perspective of a genealogist, the aristocracy was like a one-way machine, generating a constant out-flux of progeny with trees of descent that spread out into the lower class and then fade away. It appears that the reverse did not tend to happen. Within my tree, rarely do we ever see it show anyone of common origins rising up into the ranks of the wealthy. But then again, if that did tend to happen how would we know? Since history doesn't record those ancestral lines very far. So it is important to understand that while history remembers the rich and forgets the poor, inbreeding and pedigree collapse occurred in both.

Continued on page 4.
page 1,2,3,4,5,6,7,8,9 page